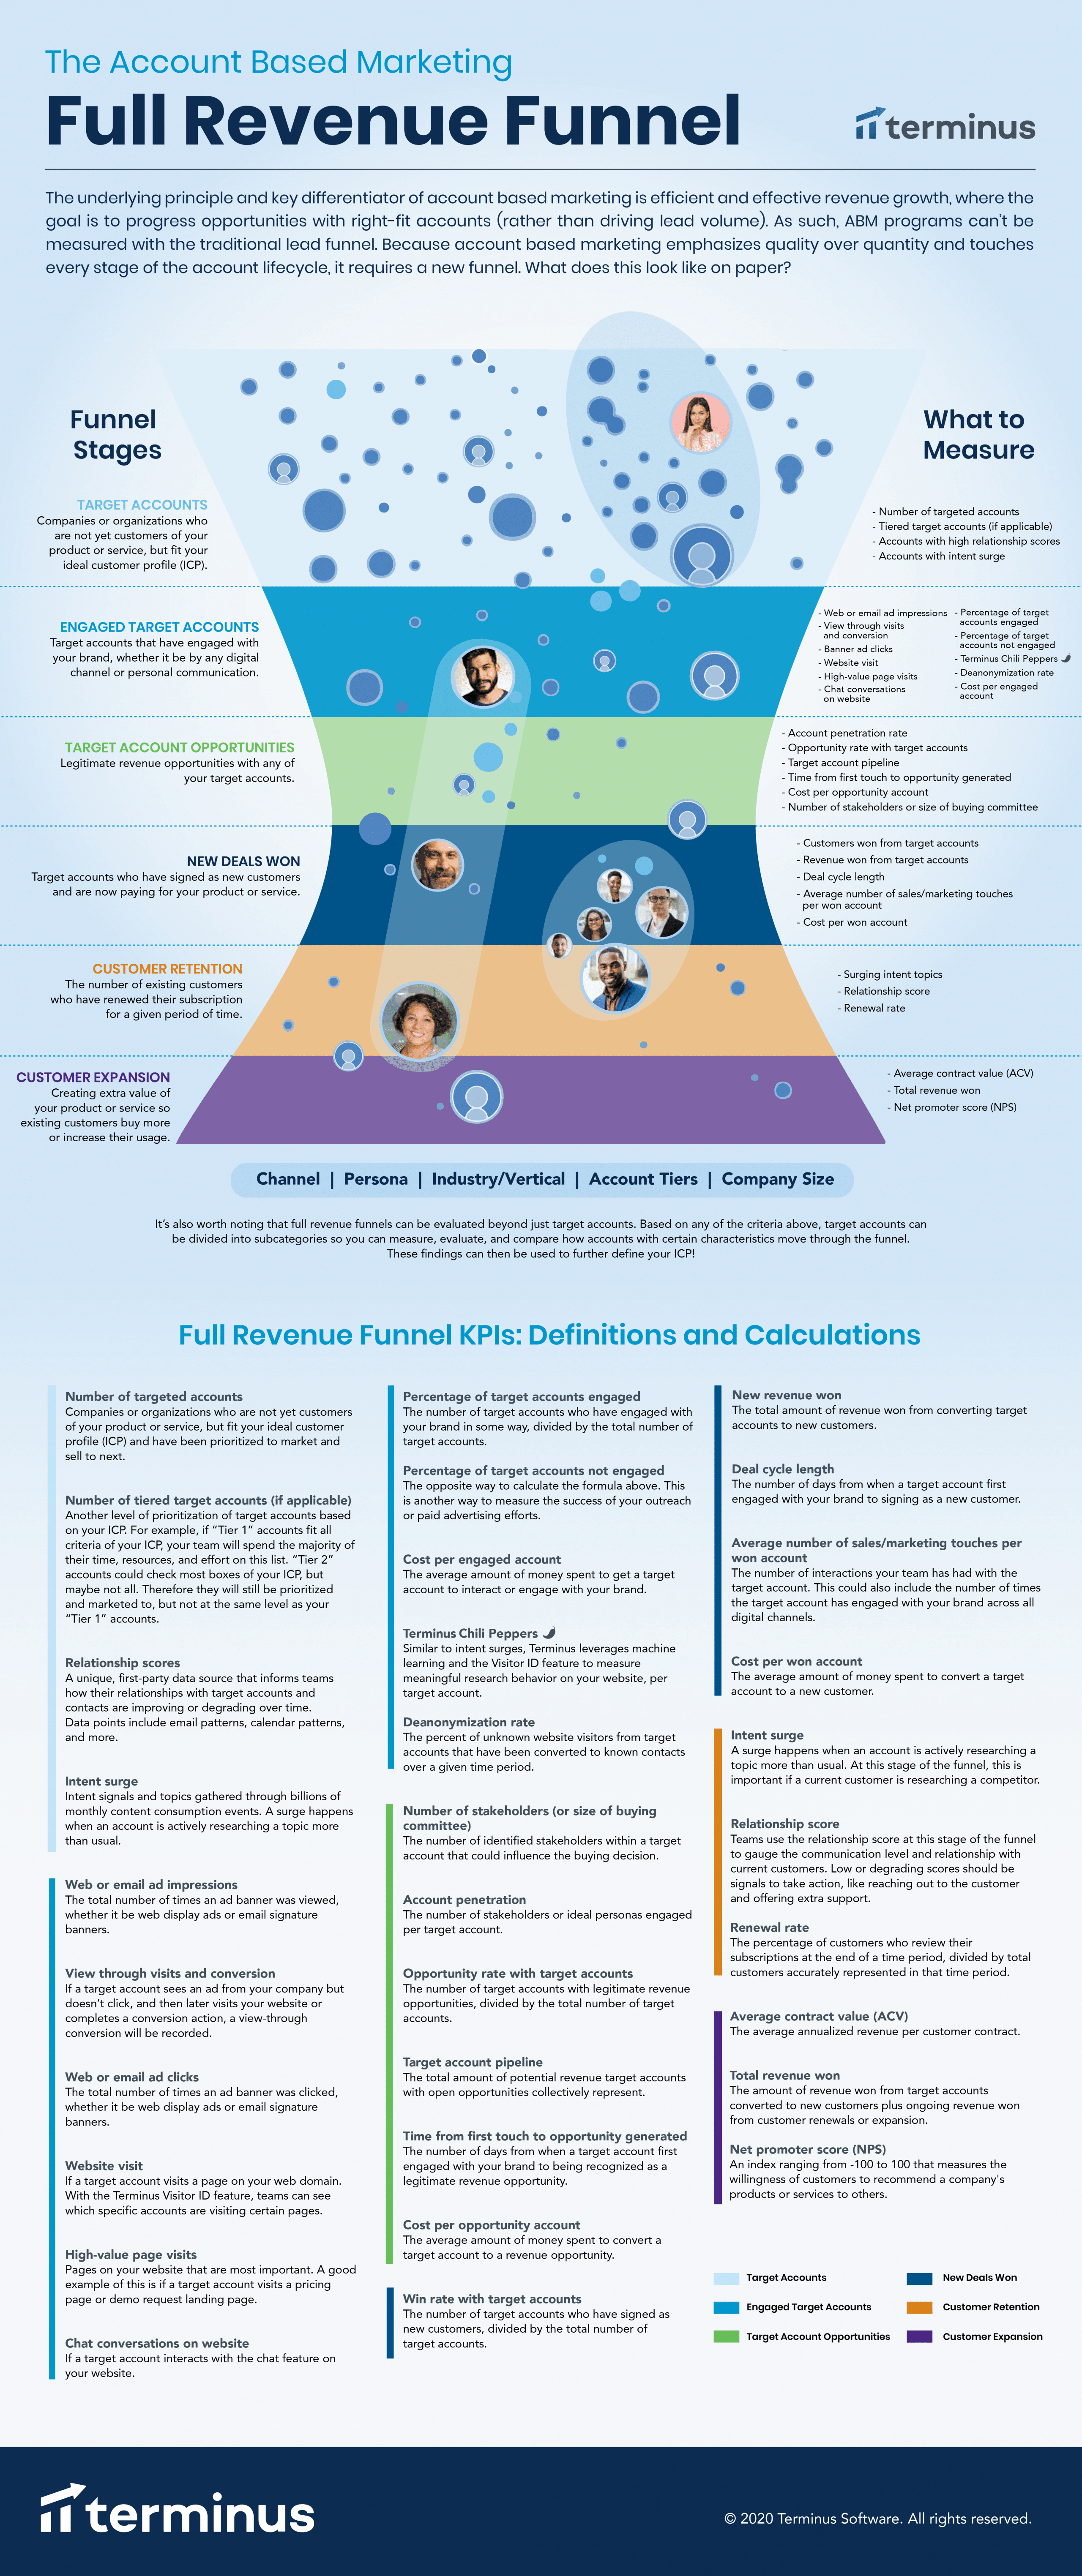
The underlying principle and key differentiator of ABM is efficient and effective revenue growth, where the goal is to progress opportunities with right-fit accounts (rather than driving lead volume). As such, ABM programs can’t be measured with the traditional lead funnel. Because account based marketing emphasizes quality over quantity and touches every stage of the account lifecycle, it requires a new funnel. So what does this look like on paper?
It starts with your target accounts, or the total number of right-fit accounts marketing and sales have agreed to target with account-based personalization. From there, it moves to engagement, identified opportunities, new customers won, and extends into customer retention and expansion. Customer lifetime value (CLTV) is the new currency of marketing, as it’s now not only about attracting customers, but also keeping them engaged through the entire lifecycle. A funnel shouldn’t just be about how marketing and sales work together to bring in new customers, it should also reflect how all revenue teams work together to delight, retain, and expand opportunities with existing customers.
To answer our original question of what this might look like on paper, we put together this handy infographic to illustrate this and more. It also includes key KPIs to measure within each stage, accompanied by calculations or definitions of each data point mentioned. Spoiler alert: there are a lot. We understand and acknowledge the fact that this could be overwhelming, especially for those just starting with ABM. However, we’re here to help and provide a framework for a crawl, walk, run approach. Your team may not need every KPI mentioned, which is 100% okay. Think of this a visual representation of anything and everything you might consider when measuring the success of your full revenue funnel.
Note: click on the infographic for the full PDF version.
In case it’s easier to have these definitions and calculations in text form, we also wrote them out below. And if you need a starting point, check out this account based marketing funnel template.
Account Based Marketing Funnel KPIs: Definitions & Calculations
Funnel Stage: Target Accounts
Companies or organizations who are not yet customers of your product or service, but fit your ideal customer profile (ICP).
Number of targeted accounts:
Companies or organizations who are not yet customers of your product or service, but fit your ideal customer profile (ICP) and have been prioritized to market and sell to next.
Number of tiered target accounts (if applicable):
Another level of prioritization of target accounts based on your ICP. For example, if “Tier 1” accounts fit all criteria of your ICP, your team will spend the majority of their time, resources, and effort on this list. “Tier 2” accounts could check most boxes of your ICP, but maybe not all. Therefore they will still be prioritized and marketed to, but not at the same level as your “Tier 1” accounts.
Relationship scores:
A unique, first-party data source that informs teams how their relationships with target accounts and contacts are improving or degrading over time. Data points include email patterns, calendar patterns, and more.
Intent surge:
Intent signals and topics gathered through billions of monthly content consumption events. A surge happens when an account is actively researching a topic more than usual.
Funnel Stage: Engaged Target Accounts
Target accounts that have engaged with your brand, whether it be by any digital channel or personal communication.
Web or email ad impressions:
The total number of times an ad banner was viewed, whether it be web display ads or email signature banners.
View through visits and conversion:
If a target account sees an ad from your company but doesn’t click, and then later visits your website or completes a conversion action, a view-through conversion will be recorded.
Web or email ad clicks:
The total number of times an ad banner was clicked, whether it be web display ads or email signature banners.
Website visit:
If a target account visits a page on your web domain. With the Terminus Visitor ID feature, teams can see which specific accounts are visiting certain pages.
High-value page visits:
Pages on your website that are most important. A good example of this is if a target account visits a pricing page or demo request landing page.
Chat conversations on website:
If a target account interacts with the chat feature on your website.
Percentage of target accounts engaged:
The number of target accounts who have engaged with your brand in some way, divided by the total number of target accounts.
Percentage of target accounts not engaged:
The opposite way to calculate the formula above. This is another way to measure the success of your outreach or paid advertising efforts.
Cost per engaged account:
The average amount of money spent to get a target account to interact or engage with your brand.
Terminus Chili Peppers 🌶️:
Similar to intent surges, Terminus leverages machine learning and the Visitor ID feature to measure meaningful research behavior on your website, per target account.
Deanonymization rate:
The percent of unknown website visitors from target accounts that have been converted to known contacts over a given time period.
Funnel Stage: Target Account Opportunities
Legitimate revenue opportunities with any of your target accounts.
Number of stakeholders (or size of buying committee):
The number of identified stakeholders within a target account that could influence the buying decision.
Account penetration:
The number of stakeholders or ideal personas engaged per target account.
Opportunity rate with target accounts:
The number of target accounts with legitimate revenue opportunities, divided by the total number of target accounts.
Target account pipeline:
The total amount of potential revenue target accounts with open opportunities collectively represent.
Time from first touch to opportunity generated:
The number of days from when a target account first engaged with your brand to being recognized as a legitimate revenue opportunity.
Cost per opportunity account:
The average amount of money spent to convert a target account to a revenue opportunity.
Funnel Stage: New Deals Won
Target accounts who have signed as new customers and are now paying for your product or service.
Win rate with target accounts:
The number of target accounts who have signed as new customers, divided by the total number of target accounts.
New revenue won:
The total amount of revenue won from converting target accounts to new customers.
Deal cycle length:
The number of days from when a target account first engaged with your brand to signing as a new customer.
Average number of sales/marketing touches per won account:
The number of interactions your team has had with the target account. This could also include the number of times the target account has engaged with your brand across all digital channels.
Cost per won account:
The average amount of money spent to convert a target account to a new customer.
Funnel Stage: Customer Retention
The number of existing customers who have renewed their subscription for a given period of time.
Intent surge:
A surge happens when an account is actively researching a topic more than usual. At this stage of the funnel, this is important if a current customer is researching a competitor.
Relationship score:
Teams use the relationship score at this stage of the funnel to gauge the communication level and relationship with current customers. Low or degrading scores should be signals to take action, like reaching out to the customer and offering extra support.
Renewal rate:
The percentage of customers who review their subscriptions at the end of a time period, divided by total customers accurately represented in that time period.
Funnel Stage: Customer Expansion
Creating extra value of your product or service so existing customers buy more or increase their usage.
Average contract value (ACV):
The average annualized revenue per customer contract.
Total revenue won:
The amount of revenue won from target accounts converted to new customers plus ongoing revenue won from customer renewals or expansion.
Net promoter score (NPS):
An index ranging from -100 to 100 that measures the willingness of customers to recommend a company’s products or services to others.